DMBI MU QPaper Solution (May 2023)
This solution is contributed by Darshan and Mangesh. Make sure to follow them on their social handles:
- Mangesh Pangam:
- LinkedIn: Mangesh Pangam
- Instagram: @Mangesh_2704
You can also read it here if you want
Q.1 A) Draw Data warehousing Architecture? (5 marks)
Ans-
A data warehouse architecture is a method of defining the overall architecture of datacommunication processing and presentation that exist for end-clients computingwithin the enterprise. Each data warehouse is different, but all are characterizedbystandard vital components.
Data warehouses and their architectures very depending upon the elements of anorganization’s situation.
Data Warehouse Architecture:
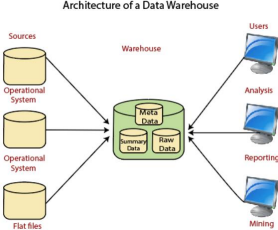
1. Operational System
An operational system is a method used in data warehousing to refer to a systemthat is used to process the day-to-day transactions of an organization.
2. Flat Files
A Flat file system is a system of files in which transactional data is stored, and everyfile in the system must have a different name.
3. Meta Data
Metadata in a data warehouse provides essential information about the stored data, aiding in its organization, retrieval, and utilization, such as authorship, creation date, and data source, facilitating efficient querying and analysis.
Prepared by Mangesh Pangam(XIE)
4. Lightly and highly summarized data
The area of the data warehouse saves all the predefined lightly and highlysummarized (aggregated) data generated by the warehouse manager. The goals of thesummarized information are to speed up query performance. The summarized recordis updated continuously as new information is loaded into the warehouse.
5. End-User access Tools
The principal purpose of a data warehouse is to provide information to the business managers for strategic decision-making. These customers interact with the warehouseusing end-client access tools.
The examples of some of the end-user access tools can be:
● Reporting and Query Tools
● Application Development Tools
● Executive Information Systems Tools
● Online Analytical Processing Tools
● Data Mining Tools
Q.1 B) What is noisy data? How to handle noisy data? (5 marks) Ans-
Noisy data is a data set that contains extra meaningless data. Almost all data sets will contain a certain amount of unwanted noise. Noisy data can be filtered and processedinto a higher quality data set.
How to handle noisy data
There are many methods to remove noise and produce the cleanest possible data. Theexact methods and implementations will depend on the data being worked on and theend goals.
1. Filtering – Filtering is removing unwanted data. This can be as simple as removingcertain categories or types of data from the analysis. Analysts may also filter out outliers, such as unusually high or low readings or ones very far frommean data set.
2. Data binning – Data binning is where the data is sorted into groups or categories toremove some of the random variance between entries.
3. Linear regression – Linear Regression is a mathematical method to determine thecorrelation b/w a data & other variables. It can help determine how closely relatedthedata is to the output.
Prepared by Mangesh Pangam(XIE)
Q.1 C) Compare and contrast between OLTP and OLAP. (5 marks) Ans-
| Sr. | No. Key | OLAP | OLTP |
1 Definition It is well-known as an online
It is well-known as an online
database query management
database modifying system.
system.
2 Basic It is used for data analysis It is used to manage verylargenumber of online short
transactions
3 Database
It uses data warehouse It uses traditional DBMS
Type
4 Data
It manages all insert,
It is mainly used for data
Modification
update and delete
reading
transaction
5 Response time Processing is little slow In Milliseconds 6 Normalization Tables in OLAP database
Tables in OLTP databaseare
are not normalized.
normalized.
7 Data source Consists of historical data
Consists of only operational
from various Databases.
current data.
8 Task It provides a multi-
It reveals a snapshot of present
dimensional view of
business tasks.
different business tasks.
9 Operations Only read and rarely write
Both read and write operations.
operations.
10 Application It is subject-oriented. Used
It is application-oriented. Used
for Data Mining, Analytics,
for business tasks.
Decisions making, etc.
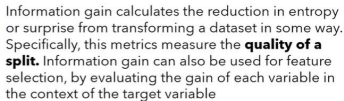
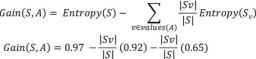
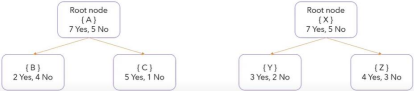
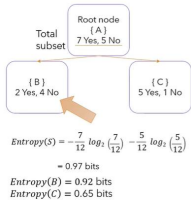
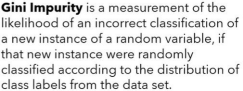
Q.1 D) Explain concept of information gain and gini value used in decisiontreealgorithm. (5 marks)
Ans-
1. Information gain
Prepared by Mangesh Pangam(XIE)
Prepared by Mangesh Pangam(XIE)
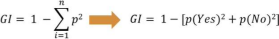
Q.2 A) What is Data mining? Explain KDD process with diagram. (10 marks) Ans-
Data mining is the process of sorting through large data sets to identify patterns andrelationships that can help solve business problems through data analysis. Data mining techniques and tools help enterprises to predict future trends and make more informed business decisions.
KDD Process
⮚ The term KDD refers to the broad process of finding knowledge in data, and emphasizes the high level application of particular data mining methods. ⮚ The goal of the KDD process is to extract knowledge from data in the context of large databases.
⮚ The overall process of finding and interpreting patterns from data involves the repeated application of the following steps:
1. Developing an understanding of:
◆ The application domain
◆ The relevant prior knowledge
◆ The goals of end user
2. Creating a target data set:
◆ Selecting a data set or focusing on a subset of variables or data samples onwhich discovery is to be performed.
3. Data cleaning and preprocessing:
◆ Removal of noise or outliers.
◆ Strategies for handling missing data fields.
Prepared by Mangesh Pangam(XIE)
4. Data reduction and projection:
◆ Finding useful features to represent the data depending on the goal of the task.
5. Choosing the data mining task:
◆ Deciding whether the goal of the KDD process is classification, regression, clustering, etc.
6. Choosing the data mining algorithm:
◆ Selecting methods to be used for searching the pattern in the data. ◆ Deciding which models and parameters may be appropriate.
◆ Matching a particular data mining method with the overall criteria of the KDD process.
7. Data mining:
◆ Searching for patterns of interest in a particular representational formor a set of such representations as classification rules or tress, regression, clustering, and so forth.
8. Interpreting mined patterns
9. Consolidating discovered knowledge
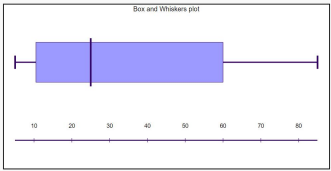
Q.2 B) Consider we have age of 29 participants in a survey given to us insortedorder. 5, 10, 13, 15, 16, 16, 20, 20, 21, 22, 22, 25, 25, 25, 25, 30, 33, 33, 35, 35, 35, 35, 36, 40, 45, 46, 52, 70, 85 Explain how to calculate mean, median, standarddeviation, 1st and 3rd Quartile for given data and also compute the same. Showthe Box and Whisker plot for this data. (10 marks)
Ans-
To calculate the mean, median, standard deviation, 1st and 3rd quartiles for the givendata, follow these steps:
1. Mean (Average):
Add up all the values and divide by the total number of values.
Mean = (5 + 10 + 13 + … + 85) / 29
= 791 / 29 ≈ 27.27
2. Median:
If the number of observations is odd, the median is the middle value. If the number of observations is even, the median is average of the two middle values. Since the number of observations is odd (29), the median is the value at position (29+1) / 2 = 15th position. Therefore, Median = 25 (the 15th value)
Prepared by Mangesh Pangam(XIE)
3. Standard Deviation:
Calculate the mean: Mean = 27.27
Subtract the mean from each value, square the result, and find the mean of thosesquared differences.
Take the square root of the mean of squared differences.
Standard Deviation ≈ √1335.91 ≈ 36.54
4. 1st and 3rd Quartile:
Quartiles divide the data set into four equal parts.
1st Quartile (Q1) is the median of the first half of the data.
3rd Quartile (Q3) is the median of the second half of the data.
Therefore, 1st Quartile (Q1) is the median of the first half of the data. Q1 = Median of (5, 10, 13, 15, 16, 16, 20, 20, 21, 22) ≈ 16 Also, 3rd Quartile (Q3) is the median of the second half of the data. Q3 = Median of (30, 33, 33, 35, 35, 35, 35, 36, 40, 45, 46, 52, 70, 85) ≈ 35
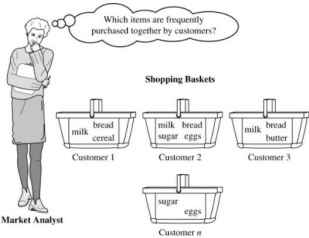
Q.3 A) Explain market Basket Analysis with example. (10 marks) Ans-
● A market basket is a collection of items purchased by a customer in a singletransaction, which is a well-defined business activity.
● For example, a customer’s visits to a grocery store or an online purchase fromavirtual store on the Web are typical customer transactions.
● Retailers accumulate huge collections of transactions by recording business activities over time.
● One common analysis run against a transactions database is to find sets of items, or itemsets, that appear together in many transactions.
Prepared by Mangesh Pangam(XIE)
● A business can use knowledge of these patterns to improve the Placement of these items in the store or the layout of mail-order catalog page and Web pages. ● An itemset containing i items is called an i-itemset.
● The percentage of transactions that contain an itemset is called the itemset’s support.
● For an itemset to be interesting, its support must be higher than a user-specifiedminimum. Such itemsets are said to be frequent.
● Rule support and confidence are two measures of rule interestingness. ● They respectively reflect the usefulness and certainty of discovered rules. ● A support of 2% for association Rule means that 2% of all the transactions under
analysis show that computer and financial management software are purchasedtogether.
● A confidence of 60% means that 60% of the customers who purchasedacomputer also bought the software.
● Typically, association rules are considered interesting if they satisfy bothaminimum support threshold and a minimum confidence threshold.
Prepared by Mangesh Pangam(XIE)
- Mangesh Pangam:
- LinkedIn: Mangesh Pangam
- Instagram: @Mangesh_2704
