AI-DS Question Paper Solution (May 2023) – IT MU
This solution is contributed by Darshan and Mangesh. Make sure to follow them on their social handles:
- Mangesh Pangam:
- LinkedIn: Mangesh Pangam
- Instagram: @Mangesh_2704
If you want to study it from here scroll down
AI & DS MU QPaper Solution (May 2023)
Q1. Attempt any four (20 marks) a. Differentiate Between Forward and Backward chaining. (5 marks) Ans-
1. Forward Chaining
It is a strategy of an expert system to answer the question, “What can happen next?” Here, the Inference Engine follows the chain of conditions and derivations and finallydeduces the outcome.
It considers all the facts and rules, and sorts them before concluding to a solution. This strategy is followed for working on conclusion, result, or effect. For example, prediction of share market status as an effect of changes in interest rates. 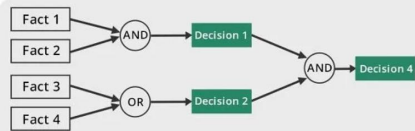
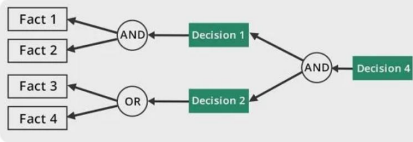
With this strategy, expert system finds out answer to question, “Why this happened?”On the basis of what has already happened, the Inference Engine tries to find out which conditions could have happened in the past for this result.
This strategy is followed for finding out cause or reason. For example, diagnosis of blood cancer in humans.
| S. No. | Forward Chaining | Backward Chaining |
| 1. | Forward chaining starts fromfacts and applies inference ruleextract more data unit it reachesthe goal. | Backward chaining starts fromthe known works backward through inferencerulesto to find the required facts that support thegoal. to |
| 2. | It is a bottom-up approach | It is a top-down approach |
| 3. | Forward chaining is knowndriven inference technique as wereach to the goal using the availabledata. | Backward chaining is known as goal-driven as data- technique as we start fromthe goal anddivide into sub-goal to extract the facts. |
| 4. | Forward chaining reasoningbreadth-first search strategy. | Backward chaining reasoning appliesa applies a depth-first search strategy. |
| 5. | Forward chaining tests for all theavailable rules | Backward chaining only tests for fewrequired rules. |
| 6. | Forward chaining is suitableplanning, monitoring, control, andinterpretation application. | Backward chaining is suitable for for the diagnostic, prescription, and debugging application. |
| 7. | Forward chaining can generateinfinite number of possibleconclusions. | Backward chaining generates a finite an number of possible conclusions. |
| 8. | It operates in the forward direction. It | operates in the backward direction. |
| 9. | Forward chaining is aimedconclusion. | Backward chaining is only aimedfor the for any required data. |
b. Compare different search techniques based on their time complexities. (5 marks)
Ans-
Comparison of different search techniques based on their time complexities 1. Linear Search:
goal and
● Linear search iterates through each element in the list until it finds the target element or reaches the end.
● Therefore, time complexity is directly proportional to size of the list. ● Time Complexity: O(n)
Prepared by Mangesh Pangam(XIE)
2. Binary Search:
● Binary search works on sorted arrays and repeatedly divides the search interval inhalf.
● This results in a time complexity that grows logarithmically with the size of thearray.
● Time Complexity: O(log n)
3. Hash Table Lookup:
● Hash table lookup provides constant-time access to elements by computingthehash of the key.
● However, in the worst-case scenario where there are many collisions, the timecomplexity can degrade to O(n).
● Time Complexity: O(1) on average (assuming a good hash function and proper handling of collisions)
4. Depth-First Search (DFS):
● In DFS, where V is the number of vertices and E is the number of edges. ● In the worst-case scenario, where every vertex is connected to every other vertex, the time complexity approaches O(n^2).
● However, in most practical cases, it’s more efficient.
● Time Complexity: O(V + E)
5. Breadth-First Search (BFS):
● Similar to DFS, BFS also has a time complexity of O(V + E), where Vis thenumber of vertices and E is the number of edges.
● In BFS, each vertex and its adjacent vertices are visited once, so it’s typicallylinear in the size of the graph.
● Time Complexity: O(V + E)
6. A* Search Algorithm:
● A* search algorithm combines the strengths of uniform cost search and greedybest-first search by using a heuristic to efficiently guide the search. The timecomplexity depends on the heuristic’s accuracy and the specific probleminstance.
● Time Complexity: It varies depending on the heuristic function and the specificproblem instance. In the worst case, it can be exponential.
Prepared by Mangesh Pangam(XIE)
c. What is a histogram? Can we perform univariate graphical analysis usinghistogram? (5 marks)
Ans-
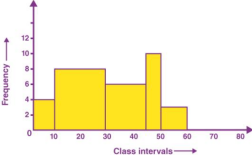
1. A histogram is a graphical representation of a grouped frequency distributionwith continuous classes.
2. It is an area diagram and can be defined as a set of rectangles with bases alongwith the intervals between class boundaries and with areas proportional tofrequencies in the corresponding classes.
3. In such representations, all the rectangles are adjacent since the base covers theintervals between class boundaries.
4. The heights of rectangles are proportional to corresponding frequencies of similar classes and for different classes, the heights will be proportional to correspondingfrequency densities.
5. Yes, we can perform univariate graphical analysis using histograms because of the following reasons:
a. Understanding Distribution:Histograms visually represent data distributionb. Identifying Central Tendency: They reveal central tendency through the shapeof the distribution.
c. Assessing Dispersion: Histogram width indicates data dispersion. d. Detecting Outliers: Outliers are visually detectable as isolated bars. e. Checking for Normality: Normality can be assessed by observing the shape of the histogram.
f. Comparing Distributions: Histograms facilitate comparison between datasets. g. Choosing Bin Width: Adjusting bin width can reveal diff data characteristics.
Adding Descriptive Statistics: Descriptive statistics can be overlaid on
| h. |
histograms for additional insights.
Prepared by Mangesh Pangam(XIE)
d. Explain various measures of the central tendencies of a statistical distribution. (5 marks)
Ans-
The central tendency of the dataset can be found out using the three important measures namely mean, median and mode.
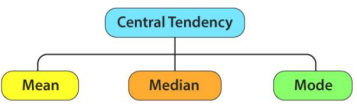
1. Mean
⮚ The mean represents the average value of the dataset.
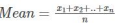
⮚ It can be calculated as sum of all the values in the dataset divided by no. of values. ⮚ In general, it is considered as the arithmetic mean.
⮚ Some other measures of mean used to find the central tendency are as follows: ◆ Geometric Mean
◆ Harmonic Mean
◆ Weighted Mean
⮚ The formula to calculate the mean value is given by:
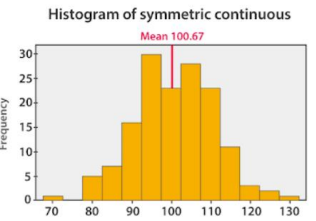
⮚ The histogram given below shows that mean value of symmetric continuous data
Prepared by Mangesh Pangam(XIE)
2. Median
⮚ Median is the middle value of the dataset in which the dataset is arranged in the ascending order or in descending order.
⮚ When the dataset contains an even number of values, then the median value of thedataset can be found by taking the mean of the middle two values. ⮚ Consider the given dataset with the odd number of observations arranged in descending order – 23, 21, 18, 16, 15, 13, 12, 10, 9, 7, 6, 5, and 2
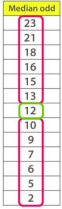
⮚ Here 12 is middle or median no that has 6 values above it and 6 values belowit.
3. Mode
⮚ The mode represents the frequently occurring value in the dataset. ⮚ Sometimes the dataset may contain multiple modes and in some cases, it does not contain any mode at all.
⮚ Consider the given dataset 5, 4, 2, 3, 2, 1, 5, 4, 5
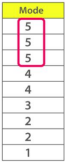
⮚ Since the mode represents the most common value. Hence, the most frequentlyrepeated value in the given dataset is 5.
Prepared by Mangesh Pangam(XIE)
e. State PEAS of automated taxi driver. (5 marks)
Ans-
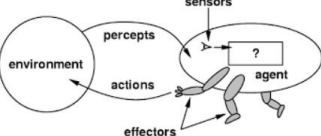
1. PEAS stands for Performance Measures, Environment, Actuators, and Sensors.
2. Performance Measure: If the objective function to judge the performance of the agent. For example, in case of pick and place robot, no of correct parts in a bincan be the performance measure.
3. Environment: It the real environment where the agent need to deliberate actions.
4. Actuators: These are the tools, equipment or organs using which agent performs actions in the environment. This works as output of the agent.
5. Sensors: These are tools, organs using which agent captures the state of the environment. This works as input to the agent.
PEAS descriptor for Automated Car Driver:
Performance Measure:
◆ Safety: Automated system should be able to drive the car safely without dashinganywhere.
◆ Optimum speed: Automated system should be able to maintain the optimal speeddepending upon the surroundings.
◆ Comfortable journey: Automated system should be able to give a comfortable journey to the end user.
Environment:
◆ Roads: Automated car driver should be able to drive on any kind of a road ranging from city roads to highway.
◆ Traffic conditions: You will find different sort of traffic conditions for different type of roads.
Actuators:
◆ Steering wheel: used to direct car in desired directions.
◆ Accelerator, gear: To increase or decrease speed of the car. Sensors:
◆ To take i/p from environment in car driving example cameras, sonar systemetc.
Prepared by Mangesh Pangam(XIE)
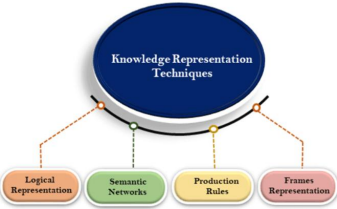
f. What are the different ways of knowledge representation? (5 marks) Ans-
There are mainly four ways of knowledge representation which are given as follows: 1. Logical Representation
2. Semantic Network Representation
3. Frame Representation
4. Production Rules
1. Logical Representation
a. Logical representation is a language with some concrete rules which deals withpropositions and has no ambiguity in representation.
b. It consists of precisely define syntax & semantics which supports the sound inference. Each sentence can be translated into logics using syntax and semantics. Syntax:
⮚ Syntaxes are the rules which decide how we can construct legal sentences in logic. ⮚ It determines which symbol we can use in knowledge representation. ⮚ How to write those symbols.
Semantics:
⮚ Semantics are the rules by which we can interpret the sentence in the logic. ⮚ Semantic also involves assigning a meaning to each sentence. Logical representation can be categorised into mainly two logics: ◆ Propositional Logics
◆ Predicate logics
Prepared by Mangesh Pangam(XIE)
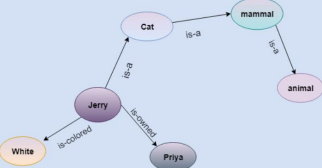
2. Semantic Network Representation
a. Semantic networks are alternative of predicate logic for knowledge representation. This network consists of nodes representing objects and arcs which describe therelationship between those objects.
b. Semantic n/w can categorize a object in different forms & can link those objects. c. This representation consist of mainly two types of relations: ◆ IS-A relation (Inheritance)
◆ Kind-of-relation
Example:
Statements:
Jerry is a cat.
Jerry is a mammal Jerry is owned by Priya.
Jerry is brown colored. All Mammals are animal.
3. Frame Representation
a. A frame is a record like structure which consists of a collection of attributes andits values to describe an entity in the world.
b. Frames are the AI data structure which divides knowledge into substructures byrepresenting stereotypes situations.
c. It consists of a collection of slots and slot values.
d. These slots may be of any type and sizes. Slots have names and values whicharecalled facets.
Facets:
The various aspects of a slot is known as Facets. Facets are features of frames whichenable us to put constraints on the frames. Example: IF-NEEDED facts are calledwhen data of any particular slot is needed.
Prepared by Mangesh Pangam(XIE)
4. Production Rules
Production rules system consist of (condition, action) pairs which mean, “If conditionthen action”. It has mainly three parts:
⮚ The set of production rules
⮚ Working Memory
⮚ The recognize-act-cycle
Example:
1. IF (at bus stop AND bus arrives) THEN action (get into the bus) 2. IF (on the bus AND paid AND empty seat) THEN action (sit down). 3. IF (on bus AND unpaid) THEN action (pay charges).
4. IF (bus arrives at destination) THEN action (get down from the bus).
Q2. a. Can 1 liter water be measured using 10 liter and 4 liter jug? Justify. (10 marks)
Ans-
Yes, it is possible to measure 1 liter of water using a 10 liter and a 4 liter jug. This is aclassic problem in recreational mathematics and can be solved using a technique known as the “Water Jug Problem”
Step 1: Fill the 10 liter jug completely with water.
[10L] [0L]
Step 2: Pour the water from the 10 liter jug into the 4 liter jug until the 4 liter jug is full. This leaves 6 liters of water in the 10 liter jug.
[6L] [4L]
Step 3: Now, you have 6 liters of water remaining in the 10 liter jug and 4 liters of water in the 4 liter jug. Pour the water from the 4 liter jug back into the container withthe 6 liters (10 liter jug)
[10L] [0L]
Step 4: Pour the remaining water from the 10 liter jug into the 4 liter jug [2L] [4L]
Step 5:Now, you have 2 liters of water remaining in the 10 liter jug and 4 liters of water in the 4 liter jug. Pour water from the 4 liter jug into the 10 liter jug until it is full. However, the 4 liter jug will be empty after this step:
Prepared by Mangesh Pangam(XIE)
[4L] [2L]
Step 6: Now, fill the 4 liter jug with water from the remaining 2 liters in the 10 liter jug
[4L] [2L]
Step 7: Finally, pour water from the 4 liter jug into the 10 liter jug until it’s full. At this point, you will have exactly 1 liter of water in the 10 liter jug [10L] [1L]
So, by using the 10 liter and 4 liter jugs iteratively, we can measure 1 liter of water.
Q2. b. Compare Linear Regression Vs Logistics Regression with suitable diagrams and formulas. (10 marks)
Ans-
1. Linear Regression and Logistic Regression are the two famous Machine LearningAlgorithms which come under supervised learning technique.
2. Since both the algorithms are of supervised in nature hence these algorithms uselabeled dataset to make the predictions.
3. But the main difference between them is how they are being used.
A. Logistic Regression
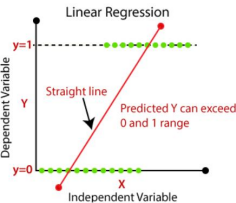
a. Linear Regression is one of the most simple Machine learning algorithmthat comes under Supervised Learning technique and used for solving regression problems.
b. It is used for predicting the continuous dependent variable with the help of independent variables.
c. The goal of the Linear regression is to find the best fit line that can accuratelypredict the output for the continuous dependent variable.
d. If single independent variable is used for prediction then it is called Simple Linear Regression and if there are more than two independent variables then suchregression is called as Multiple Linear Regression.
e. By finding the best fit line, algorithm establish the relationship between dependent variable and independent variable. And the relationship should be of linear nature.
f. The output for Linear regression should only be the continuous values such as price, age, salary, etc.
Prepared by Mangesh Pangam(XIE)
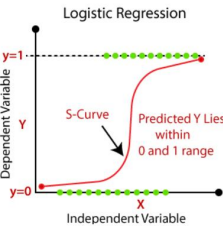
B. Logistic Regression
a. Logistic regression is one of the most popular Machine learning algorithmthat comes under Supervised Learning techniques.
b. It can be used for Classification as well as for Regression problems, but mainlyused for Classification problems.
c. Logistic regression is used to predict the categorical dependent variable with thehelp of independent variables.
d. The output of Logistic Regression problem can be only between the 0 and 1. e. Logistic regression can be used where the probabilities between two classes is required. Such as whether it will rain today or not, either 0 or 1, true or false etc. f. Logistic regression is based on the concept of Maximum Likelihood estimation. According to this estimation, the observed data should be most probable.
Prepared by Mangesh Pangam(XIE)
| Parameter | Linear Regression | Logistic Regression |
| Outcome VariableType | Continuous variable (e.g., price, temperature) | Categorical variable, typicallybinary (e.g., yes/no, 0/1) |
| Model Purpose | Regression (predictingnumerical values) | Classification (categorizinginto discrete classes) |
| Equation/Function | Linear equation: Y+ ε | Logistic (Sigmoid) function: = β0 + β1X p(X) = 1 / (1 + e^-(β0+β1X)) |
| Output Interpretation | Predicted value of thedependent variable | Probability of a particularclass or event |
| RelationshipVariables | Assumes a linear relationship Between between variables | Does not assume a linearrelationship; modelsprobability |
| Error Distribution | Assumes normally distributederrors | Does not assume a normaldistribution of errors |
| Estimation Method | Ordinary Least Squares | (OLS) MaximumLikelihoodEstimation (MLE) |
| Sensitivity to | Outliers More sensitive to outliers | Less sensitive to outliers |
| HomoscedasticityAssumption | Assumes homoscedasticity(constant variance of errors) | No assumption ofhomoscedasticity |
| Application | Suitable for forecasting, effectanalysis of independent Scope variables | Ideal for binary classificationin various fields |
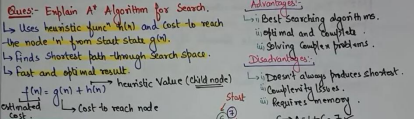
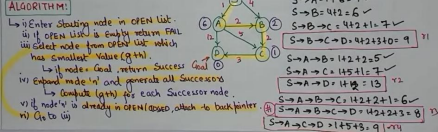
Q3. a. State A* algorithm and explain with example how A* searching algorithmhelps in finding the goal with optimal path. (10 marks)
Ans-
Q3. b. With respect to Quantitative data analysis explain following: (10 marks) i. Measure of central tendencies
ii. Measure of spread
iii. Skewness and Kurtosis
Ans
i. Measure of central tendencies
Ans- Refer Q1. d
ii. Measure of spread
1. The dispersion, which is also called scatter is measured on the basis of the type of chosen central tendency and the observations available to us. 2. These measures tell us how much observations are varied or similar to each other. 3. There are many ways of measuring the dispersion in the data, some major ways to measure the spread are given below:
⮚ Range
⮚ Variance
⮚ Standard Deviation
Prepared by Mangesh Pangam(XIE)
1. Range
⮚ The range of the data is given as the difference between the maximumand the minimum values of the observations in the data.
⮚ For example, let’s say we have data on the number of customers walking in the store in a week. 10, 14, 8, 10, 15, 4, 7
Minimum value in data = 7
Maximum Value in the data = 15
Range = Maximum Value in the data – Minimum value in the data = 15 – 7
= 8
2. Variance
⮚ The variance of the data is given by measuring the distance of the observed values from the mean of the distribution.
⮚ Here we are not concerned with the sign of the distance of the point, we are moreinterested in the magnitude.
⮚ So, we take squares of the distance from the mean. Let’s say we have x1, x2, x3 …. xn as n observations and σ be the mean.
⮚ But this measure is still dependent on the number of observations in the data. That is if there are lots of observations this value will become large. So, we take the mean of the data,
3. Standard Deviation
⮚ In the calculation of variance, notice that the units of the variance and the unit of the observations are not the same.
⮚ So, to remove this problem, we define standard deviation.
⮚ It is denoted as σ
Prepared by Mangesh Pangam(XIE)
iii. Skewness and Kurtosis
1. Skewness
⮚ Skewness defines the shape of the distribution. Usually, we get a lot of asymmetric distributions, and these distributions have unevenly spread data. There are two types of skewness – positive or right-skewed and negative or left- skewed.
⮚ Positive skewness is when the distribution takes place so that we get a long tail towards the right side of the graph. This is called a right-skewed graph,
⮚ In this distribution, the mean is greater than the median, which is greater thanthemode. That is, we get mean > median > mode.
⮚ Negative skewness is when the distribution takes place so that we get a long tail towards the left side of the graph. This is called a left-skewed graph.
2. Kurtosis
Kurtosis is a statistical measure that describes the degree of peakedness or flatness of a distribution.
Kurtosis is useful to identify the potential outliers in a dataset, as distributions withhigh kurtosis have more extreme values than normal distributions.
Types of Kurtosis:
Mesokurtic: This is a type of distribution in which there is symmetry. This is the same as the normal distribution.
Leptokurtic: This distribution has a greater kurtosis than the mesokurtic, which has longer tails. This indicates that a more significant percentage of data is present near the tail, which causes the tail to get longer.
Platykurtic: This distribution has lower kurtosis than the mesokurtic. This means there is less data in the tail portion, which makes the tail flatter.
Prepared by Mangesh Pangam(XIE)
Q4. a.
1. Marcus was a man.
2. Marcus was a Pompeian.
3. All Pompeians were Romans.
4. Caesar was a ruler.
5. All Pompeians were either loyal to Caesar or hated him. 6. Every one is loyal to someone.
7. People only try to assassinate rulers they are not loyal to.
8. Marcus tried to assassinate Caesar.
Was Marcus loyal to Casear ? Solve using resolution. (10 marks) Ans-
Prepared by Mangesh Pangam(XIE)
Q4. b. In detail, explain steps in the Data Science Project. (10 marks) Ans-
Steps for Data Science Project:
Step 1: Defining research goals and creating a project charter Spend time understanding the goals and context of your research.Continue askingquestions and devising examples until you grasp the exact business expectations, identify how your project fits in the bigger picture, appreciate how your research is going to change the business, and understand how they’ll use your results. Create a project charter
A project charter requires teamwork,& your input covers at least following: ● A clear research goal
● The project mission and context
● How you’re going to perform your analysis
● What resources you expect to use
● Proof that it’s an achievable project, or proof of concepts ● Deliverables and a measure of success
● A timeline
Step 2: Retrieving Data
Start with data stored within the company
● Finding data even within your own company can sometimes be a challenge. ● This data can be stored in official data repositories such as databases, data marts, data warehouses, and data lakes maintained by a teamof IT professionals.
● Getting access to the data may take time and involve company policies.
Step 3: Cleansing, integrating, and transforming data-
1. Cleaning:
⮚ Data cleansing is a subprocess of the data science process that focuses on removing errors in your data so your data becomes a true and consistent representation of the processes it originates from.
⮚ The first type is the interpretation error, such as incorrect use of terminologies, like saying that a person’s age is greater than 300 years.
⮚ The second type of error points to inconsistencies between data sources or against your company’s standardized values. An example of this class of errors is putting
Prepared by Mangesh Pangam(XIE)
“Female” in one table and “F” in another when they represent the same thing: that the person is female.
2. Integrating:
⮚ Combining Data from different Data Sources.
⮚ Your data comes from several different places, and in this sub step we focus onintegrating these different sources.
⮚ You can perform two operations to combine information from different data sets. The first operation is joining and the second operation is appending or stacking. ⮚ Joining Tables:
■ Joining tables allows you to combine the information of one observation foundin one table with the information that you find in another table.
⮚ Appending Tables:
■ Appending or stacking tables is effectively adding observations fromone tableto another table.
3. Transforming Data
⮚ Certain models require their data to be in a certain shape.
⮚ Reducing the Number of Variables
⮚ Sometimes you have too many variables and need to reduce the number becausethey don’t add new information to the model.
⮚ Having too many variables in your model makes the model difficult to handle, and certain techniques don’t perform well when you overload themwith too many input variables.
⮚ Dummy variables can only take two values: true(1) or false(0). They’re used toindicate the absence of a categorical effect that may explain the observation.
Step 4: Exploratory Data Analysis
⮚ During exploratory data analysis you take a deep dive into the data. ⮚ Information becomes much easier to grasp when shown in a picture, therefore you mainly use graphical techniques to gain an understanding of your data andthe interactions between variables.
⮚ Bar Plot, Line Plot, Scatter Plot ,Multiple Plots , Pareto Diagram, Link and Brush Diagram ,Histogram , Box and Whisker Plot .
Prepared by Mangesh Pangam(XIE)
Step 5: Build the Models
Build the models are the next step, with the goal of making better predictions, classifying objects, or gaining an understanding of the system that are required for modeling.
Step 6: Presenting findings and building applications on top of them– ⮚ The last stage of the data science process is where your soft skills will be most useful, and yes, they’re extremely important.
⮚ Presenting your results to the stakeholders and industrializing your analysis process for repetitive reuse and integration with other tools.
Q5. a. What are the different types of Machine Learning algorithms? Giveexample of each category. (10 marks)
Ans-
Machine Learning Algorithm can be broadly classified into three types:
1. Supervised Learning Algorithms
2. Unsupervised Learning Algorithms
3. Reinforcement Learning Algorithms
1) Supervised Learning Algorithm
Supervised learning is a type of Machine learning in which the machine needs external supervision to learn. The supervised learning models are trained usingthe
Prepared by Mangesh Pangam(XIE)
labeled dataset. Once the training and processing are done, the model is testedbyproviding a sample test data to check whether it predicts the correct output.
The goal of supervised learning is to map input data with the output data. Supervisedlearning is based on supervision, and it is the same as when a student learns things inthe teacher’s supervision. The example of supervised learning is spamfiltering.
Supervised learning can be divided further into two categories of problem:
o Classification
o Regression
Examples of some popular supervised learning algorithms are Simple Linear regression, Decision Tree, Logistic Regression, KNN algorithm, etc. Read more..
2) Unsupervised Learning Algorithm
It is a type of machine learning in which the machine does not need any external supervision to learn from the data, hence called unsupervised learning. Theunsupervised models can be trained using the unlabelled dataset that is not classified, nor categorized, and the algorithm needs to act on that data without any supervision. In unsupervised learning, the model doesn’t have a predefined output, and it tries tofind useful insights from the huge amount of data. These are used to solve theAssociation and Clustering problems. Hence further, it can be classified intotwotypes:
o Clustering
o Association
Examples of some Unsupervised learning algorithms are K-means Clustering, Apriori Algorithm, Eclat, etc.
3) Reinforcement Learning
In Reinforcement learning, an agent interacts with its environment by producingactions, and learn with the help of feedback. The feedback is given to the agent intheform of rewards, such as for each good action, he gets a positive reward, and for eachbad action, he gets a negative reward. There is no supervision provided totheagent. Q-Learning algorithm is used in reinforcement learning.
The various Machine Learning algorithms are:
1. Linear Regression
⮚ Linear regression is one of the most popular and simple machine learning algorithms that is used for predictive analysis. Here, predictive analysis defines prediction of something, and linear regression makes predictions for continuous numbers such as salary, age, etc.
Prepared by Mangesh Pangam(XIE)
⮚ It shows the linear relationship between the dependent and independent variables, and shows how the dependent variable(y) changes according to the independent variable (x).
2. Logistic Regression
⮚ Logistic regression is the supervised learning algorithm, which is used to predict the categorical variables or discrete values.
⮚ It can be used for the classification problems in machine learning, and the output of logistic regression algorithm can be either Yes or NO, 0 or 1, Red or Blue, etc. ⮚ Logistic regression is similar to the linear regression except how they are used, such as Linear regression is used to solve the regression problemand predict continuous values, whereas Logistic regression is used to solve the Classificationproblem and used to predict the discrete values.
3. Decision Tree Algorithm
⮚ A decision tree is a supervised learning algorithm that is mainly used to solve theclassification problems but can also be used for solving the regression problems. ⮚ It can work with both categorical variables and continuous variables. ⮚ It shows a tree-like structure that includes nodes and branches, and starts withtheroot node that expand on further branches till the leaf node.
⮚ The internal node is used to represent the features of the dataset, branches showthe decision rules, and leaf nodes represent the outcome of the problem.
4. Support Vector Machine Algorithm ⮚ A support vector machine or SVM is a supervised learning algorithmthat canalso be used for classification and regression problems.
⮚ However, it is primarily used for classification problems.
⮚ The goal of SVM is to create a hyperplane or decision boundary that can segregate datasets into different classes.
⮚ The data points that help to define the hyperplane are known as support vectors, and hence it is named as support vector machine algorithm.
5. Naïve Bayes Algorithm:
⮚ Naïve Bayes classifier is a supervised learning algorithm, which is used to makepredictions based on the probability of the object.
Prepared by Mangesh Pangam(XIE)
⮚ The algorithm named as Naïve Bayes as it is based on Bayes theorem, and follows the naïve assumption that says’ variables are independent of each other. ⮚ The Bayes theorem is based on the conditional probability; it means a likelihoodthat event(A) will happen, when it is given that event(B) has already happened. ⮚ The equation for Bayes theorem is given as:
6. K-Nearest Neighbour (KNN)
⮚ K-Nearest Neighbour is a supervised learning algorithm that can be used for bothclassification and regression problems.
⮚ This algorithm works by assuming the similarities between the newdata point and available data points.
⮚ Based on these similarities, the new data points are put in the most similar categories.
⮚ The distance function can be Euclidean, Minkowski, Manhattan, or Hammingdistance, based on the requirement.
7. K-Means Clustering
⮚ K-means clustering is one of the simplest unsupervised learning algorithms, which is used to solve the clustering problems.
⮚ The datasets are grouped into K different clusters based on similarities and dissimilarities, it means, datasets with most of the commonalties remain in one cluster which has very less or no commonalities between other clusters.
⮚ In K-means, K-refers to the number of clusters, and means refer to the averagingthe dataset in order to find the centroid.
8. Random Forest Algorithm
⮚ Random forest is the supervised learning algorithm that can be used for both classification and regression problems in machine learning.
⮚ It is an ensemble learning technique that provides the predictions by combiningthe multiple classifiers and improve the performance of the model.
Prepared by Mangesh Pangam(XIE)
Q5. b. Can min-max be used for team games? Draw sample trees for 2 and3teams. (10 marks)
Ans-
⮚ Yes, the Min-Max algorithm can be used for team games, particularlyinscenarios where teams compete against each other.
⮚ The Min-Max algorithm is a decision-making algorithm often used in gametheory to determine the best possible move for a player, assuming that theopponent is also playing optimally.
⮚ In the context of team games, each team can be considered as a player, andthealgorithm can be applied to determine the best collective moves for each team. ⮚ Here are sample trees for 2 teams and 3 teams:
1. Sample Min-Max Tree for 2 Teams:
In this example, let’s consider a simple scenario where Team A and TeamBareplaying against each other. Each team has two possible moves: Move 1 and Move 2.
In this tree:
– Team A is the maximizing player (Max), trying to maximize its score. – Team B is the minimizing player (Min), trying to minimize Team A’s score.
2. Sample Min-Max Tree for 3 Teams:
In this example, let’s consider a scenario where Team A, Team B, and TeamCareplaying against each other. Each team has 3 possible moves: Move 1, Move 2,Move 3.
Prepared by Mangesh Pangam(XIE)
In this tree:
– Team A is the maximizing player (Max), trying to maximize its score. – Both Team B and Team C are the minimizing players (Min), trying to minimizeTeam A’s score.
Q6. a. Consider you are performing ML for predicting housing prices youhavetrained three models and following data summarizes the predicted house priceby each model for 5 different trial runs.
Perform One way ANOVA F Test on this data and comment on whether themean house price predicted by models A, B, C are same with level of significance0.05. (Use of F Table is allowed) (10 marks) Ans-
To perform the One-Way ANOVA F Test, we’ll follow these steps: 1. Calculate the mean for each treatment group (model A, B, C).
2. Calculate the overall mean (grand mean) of all data points.
3. Calculate the sum of squares between groups (SSB), sum of squares within groups (SSW), and total sum of squares (SST).
4. Calculate the degrees of freedom (df) for between groups (dfB) and within groups (dfW).
5. Calculate the mean squares between groups (MSB) and mean squares within groups (MSW).
6. Calculate the F-statistic.
7. Determine the critical value of the F-statistic from the F-distribution table for thegiven significance level and degrees of freedom.
8. Compare the calculated F-statistic with the critical value.
9. Make a decision: If the calculated F-statistic is greater than the critical value, reject the null hypothesis and conclude that at least one of the treatment means differs from the others. Otherwise, fail to reject the null hypothesis.
Prepared by Mangesh Pangam(XIE)
Given data:
Model A: [3.5, 3.4, 3.8, 3.5]
Model B: [3.9, 3.8, 3.7, 3.9]
Model C: [3.5, 3.3, 3.6, 3.5]
1. Calculate the mean for each treatment group (model A, B, C): Mean_A = (3.5 + 3.4 + 3.8 + 3.5) / 4 = 3.55
Mean_B = (3.9 + 3.8 + 3.7 + 3.9) / 4 = 3.825
Mean_C = (3.5 + 3.3 + 3.6 + 3.5) / 4 = 3.475
2. Calculate the overall mean (grand mean):
Grand_mean = (3.55 + 3.825 + 3.475) / 3 = 3.6167
3. Calculate the sum of squares between groups (SSB):
SSB = (4 * (3.55 – 3.6167)^2) + (4 * (3.825 – 3.6167)^2) + (4 * (3.475 – 3.6167)^2) = 0.7644 + 0.6244 + 0.6756
= 2.0644
4. Calculate the sum of squares within groups (SSW):
SSW = ( (3.5 – 3.55)^2 + (3.4 – 3.55)^2 + (3.8 – 3.55)^2 + (3.5 – 3.55)^2 ) + ( (3.9 – 3.825)^2 + (3.8 – 3.825)^2 + (3.7 – 3.825)^2 + (3.9 – 3.825)^2 ) + ( (3.5 – 3.475)^2 + (3.3 – 3.475)^2 + (3.6 – 3.475)^2 + (3.5 – 3.475)^2 )
= 0.06 + 0.09 + 0.09 + 0.06 + 0.0625 + 0.00625 + 0.0625 + 0.0625 + 0.0125 +0.1325+ 0.0125 + 0.0125 = 0.725
5. Calculate the total sum of squares (SST):
SST = SSB + SSW
= 2.0644 + 0.725
= 2.7894
6. Calculate the degrees of freedom (df):
dfB = k – 1 = 3 – 1 = 2
dfW = N – k = 12 – 3 = 9
7. Calculate the mean squares:
MSB = SSB / dfB = 2.0644 / 2 = 1.0322
MSW = SSW / dfW = 0.725 / 9 = 0.0806
Prepared by Mangesh Pangam(XIE)
8. Calculate the F-statistic:
F = MSB / MSW = 1.0322 / 0.0806 = 12.8056
9. Determine the critical value of the F-statistic for the given significance level (0.05) and degrees of freedom (2, 9) using an F-distribution table. From the F-distribution table, the critical value for F(2, 9) at significance level 0.05 is approximately 4.26.
10. Compare the calculated F-statistic with the critical value: 12.8056 > 4.26
11. Make a decision:
Since the calculated F-statistic (12.8056) is greater than the critical value(4.26), we reject the null hypothesis. There is sufficient evidence to conclude that at least one of the treatment means differs from the others.
Therefore, we can conclude that the mean house prices predicted by models A, B, andC are not all the same at a significance level of 0.05.
Q6. b. What are the rules of conversion from predicate to CNF? Explaineachrule with proper example. (10 marks)
Ans-
Prepared by Mangesh Pangam(XIE)
Prepared by Mangesh Pangam(XIE)
Prepared by Mangesh Pangam(XIE)
