AI-DS Question Paper Solution (DEC 2023) – IT MU
This solution is contributed by Darshan and Mangesh. Make sure to follow them on their social handles:
- Mangesh Pangam:
- LinkedIn: Mangesh Pangam
- Instagram: @Mangesh_2704
AI & DS MU QPaper Solution (Dec 2023)
Q1. Solve any four (20 marks) a. Write comparison between Business Intelligence and Data Science. (5 marks) Ans-
Prepared by Mangesh Pangam(XIE)
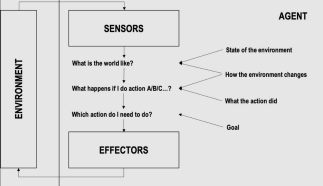
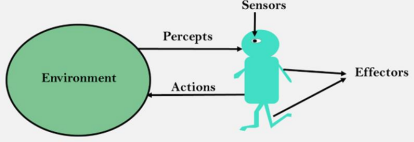
b. What is rational agent? Explain with diagram. (5 marks) Ans-
1. A rational agent is an agent which has clear preferences and models uncertaintyvia expected values.
2. A rational agent can be anything that makes decisions, typically a person, firm, machine, or software.
3. A rational agent always performs right action, where the right action means the action that causes the agent to be most successful in the given percept sequence.
4. Rational agent is capable of taking best possible action in any situation.
5. Example of rational action performed by any intelligent agent: Automated Taxi Driver:
⮚ Performance Measure: Safe, fast, legal, comfortable trip, maximize profits. ⮚ Environment: Roads, other traffic, customers.
⮚ Actuators: Steering wheel, accelerator, brake, signal, horn.
⮚ Sensors: Cameras, sonar, speedometer, GPS, odometer, engine sensors, keyboard.
c. Explain what role is played by Correlation and Covariance in EDA? (5 marks) Ans-
Correlation and covariance are both statistical measures used in Exploratory Data Analysis (EDA) to understand the relationship between variables in a dataset. 1. Correlation
⮚ Correlation means, correlation between two variables which is a normalized version of the covariance.
⮚ The range of correlation coefficients is always between -1 to 1. ⮚ The correlation coefficient is also known as Pearson’s correlation coefficient.
Prepared by Mangesh Pangam(XIE)
Significance
● -1 and +1 indicate that both variables have a perfect linear relationship. ● Negative means they are inversely proportional to each other with the factor of correlation coefficient value.
● Positive means they are directly proportional to each other mean vary in the same direction with the factor of correlation coefficient value.
● if the correlation coefficient is 0 then it means there is no linear relationshipbetween variables.
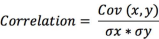
Where,
Correlation = sample correlation between X and Y Cov(X,Y) = sample covariance between X and Y Sigma x = sample standard deviation of X
Sigma y = sample standard deviation of Y
2. Covariance
⮚ Covariance is a measured use to determine how much variable change in randomly.
⮚ The covariance is a product of the units of the two variables.
⮚ The value of covariance lies between -∞ and +∞. ⮚ The covariance of two variables (x and y) can be represented by cov(x,y). ⮚ E[x] is the expected value or also called as means of sample ‘x’.
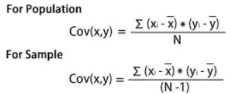
Where,
x̄= sample mean of x
ȳ = sample mean of y
x_i and y_i = the values of x and y for ith record in the sample.
N = is the no of records in the sample
Prepared by Mangesh Pangam(XIE)
d. What are heuristic functions? Where are they used? (5 marks) Ans-
1. Heuristic Function is a function that estimates the cost of getting fromone placeto another (from the current state to the goal state.)
2. It is also called as simply a heuristic.
3. Used in a decision process to try to make the best choice of a list of possibilities (to choose the move more likely to lead to the goal state).
4. Best move is the one with the least cost.
5. The objective of a heuristic is to produce a solution in a reasonable time frame that is good enough for solving the problem at hand.
6. It can also be defined thus as a function that ranks alternatives in search algorithms at each branching step based on available information to decide whichbranch to follow.
7. Example for Blocks World Problem:
Consider below mentioned Start & Goal states for Blocks World
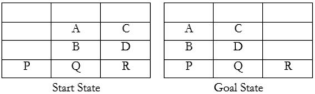
Heuristic’s function:
h(s) = Number of places with incorrect block immediately on top of it
e. What is Unification? Give example. (5 marks)
Ans-
1. Unification is a process of making two different logical atomic expressions identical by finding a substitution. Unification depends on the substitutionprocess.
2. It takes two literals as input and makes them identical using substitution. 3. Let Ψ1 and Ψ2 be two atomic sentences and σ be a unifier such that, Ψ1σ=Ψ2σ, then it can be expressed as UNIFY(Ψ1, Ψ2).
4. Example: Find the MGU for Unify{King(x), King(John)} Let Ψ1 = King(x), Ψ2 = King(John),
Substitution θ = {John/x} is a unifier for these atoms and applying this substitution, and both expressions will be identical.
● The UNIFY algorithm is used for unification, which takes two atomicsentences and returns a unifier for those sentences (If any exist).
Prepared by Mangesh Pangam(XIE)
● Unification is a key component of all first-order inference algorithms. ● It returns fail if the expressions do not match with each other. ● The substitution variables are called Most General Unifier or MGU.
f. What is Skolemization? Explain Skolem constant and Skolemfunction. (5 marks)
Ans-
Skolemization is a technique used in logic and mathematical logic to eliminate existential quantifiers from a formula.
It’s particularly useful in the context of first-order logic and resolution-based automated theorem proving.
Skolemization transforms a formula with existential quantifiers into an equivalent formula without them.
1. Skolem Constant:
⮚ A Skolem constant is introduced during Skolemization to replace existential quantified variables.
⮚ Suppose we have an existential quantified variable in a formula, such as ∃x P(x), where P(x) is some predicate.
⮚ Skolemization replaces the existential quantifier with a new constant symbol, sayc, resulting in P(c).
⮚ The Skolem constant c is essentially a placeholder for an arbitrary object that satisfies the existential quantified predicate.
2. Skolem Function:
⮚ In cases where the existential quantification involves multiple variables or depends on other variables, Skolem functions are used.
⮚ A Skolem function is introduced to replace the existential quantified variables. It’s a function that takes other variables as arguments and returns a value satisfying the existential quantified predicate.
⮚ For example, if we have an existential quantification like ∃x,y Q(x,y), where Q(x,y) is some predicate, Skolemization introduces a new function symbol, sayf, resulting in Q(f(x),f(y)).
⮚ The Skolem function f takes variables x and y as arguments and returns values that satisfy the predicate Q.
Prepared by Mangesh Pangam(XIE)
Q2. a. Write a detailed note on Hypothesis Testing. What are type I and type II errors? (10 marks)
Ans-
1. Test of Hypothesis (Hypothesis Testing) is a process of testing of the significanceregarding the parameters of the population on the basis of sample drawn fromit. 2. Test of hypothesis is also called as ‘Test of Significance’.
3. The main purpose of hypothesis testing is to help the researcher in reaching a conclusion regarding the population by examining a sample taken fromthat population.
4. The hypothesis testing does not provide proof for the hypothesis. 5. The test only indicates whether the hypothesis is supported or not supported bythe available data.
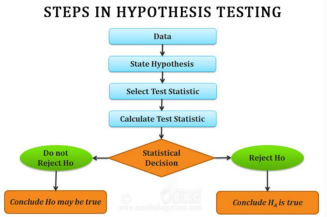
Errors in hypothesis testing refer to the incorrect conclusions that can occur whenconducting statistical tests to evaluate research hypotheses. There are two types of errors: Type I errors and Type II errors.
1. Type I Error
● Also known as a false positive, Type I error occurs when the null hypothesis is incorrectly rejected when it is actually true.
● In other words, it is the probability of concluding that there is a significant effect or difference when there is none.
● Type I errors are denoted by the symbol α (alpha) and are typically set at a predetermined level, such as α = 0.05 or α = 0.01, representing the probabilityof making a Type I error.
Prepared by Mangesh Pangam(XIE)
2. Type II Error
● Also known as a false negative, Type II error occurs when the null hypothesis is incorrectly retained when it is actually false.
● It is the probability of failing to detect a significant effect or difference when onetruly exists.
● Type II errors are denoted by the symbol β (beta).
● The complement of β, known as the statistical power (1-β), represents the probability of correctly rejecting the null hypothesis when it is false.
1. Both Type I and Type II errors are inherent in hypothesis testing and are influenced by factors such as sample size, effect size, and the chosen level of significance (α).
2. Researchers aim to minimize both types of errors, but there is often a trade-off between them.
3. For example, decreasing the risk of Type I error (α) by lowering the significancelevel may increase the risk of Type II error (β), and vice versa. T 4. herefore, it is essential for researchers to carefully consider the potential for errors and make informed decisions when interpreting the results of hypothesis tests.
Q2. b. The law says that it is a crime for an American to sell weapons to hostile nations. The country Nono, an enemy of America, has some missiles, and all of its missiles were sold to it by Colonel West, who is American. Prove that Col. West is a criminal! (10 marks)
Ans-
The law says that it is a crime for an American to sell weapons to hostile nations. Thecountry, Nono, an enemy of America, has some missiles, and all of its missiles weresold to it by Colonel West, who is an American.
1. … it is a crime for an American to sell weapons to hostile nations: American(x) ∧ Weapon(y) ∧ Sells(x, y, z) ∧ Hostile(z) ⟹Criminal(x) 2. Nono .. Has some missiles ∃x Owns(Nono, x) ∧ Missile (x): 3. .. All of its missiles were sold to it by Col. West:
∀x Owns(Nono, x) ∧ Missile (x) ⟹Sells(West, x, Nono)
Prepared by Mangesh Pangam(XIE)
4. Missiles are weapons:
∀x Missile (x) ⟹Weapon(x)
5. An enemy of America counts as hostile:
∀ x Enemy(x, America) ⟹Hostile(x)
6. West, who is an American..⟹American(West)
7. The country Nono, an enemy of America ⟹Enemy(Nono, America) ∀x Owns(Nono, x) ∧ Missile (x) ⟹Sells(West, x, Nono)
∀x Missile (x) ⟹Weapon(x)
American(x) ∧ Weapon(y) ∧ Sells(x, y, z) ∧ Hostile(z) ⟹Criminal(x) This proves that Col. West is a criminal!
Q3. a. Explain uniform cost search and best first search in detail with examples and compare. (10 marks)
Ans-
Uniform Cost Search (UCS) and Best First Search (BFS) are both search algorithms commonly used in the field of artificial intelligence and graph theory to find the optimal path from a start node to a goal node in a graph. However, they differ in their strategies for exploring the search space.
1. Uniform Cost Search (UCS):
⮚ UCS is a variant of Dijkstra’s algorithm that explores the search space by expanding nodes in increasing order of their path costs from the start node. ⮚ It maintains a priority queue (usually implemented using a min-heap) to store nodes based on their path costs. The node with the lowest path cost is always chosen for expansion.
Prepared by Mangesh Pangam(XIE)
⮚ UCS continues expanding nodes until it reaches the goal node or until the entiresearch space has been explored.
⮚ UCS guarantees finding the shortest path to the goal node in terms of path cost, assuming non-negative edge weights.
⮚ For e.g.- a path from S to G1-{S->A -> G1} whose cost is SA +AG1 = 5 +9 =14
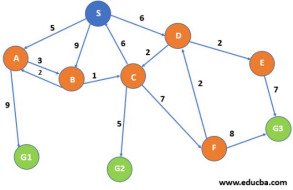
Here we will maintain a priority queue the same as BFS with the cost of the path as its priority, lower the cost higher is the priority.
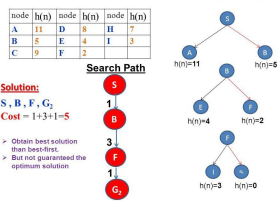
2. Best First Search (BFS):
⮚ BFS is a general search algorithm that selects nodes for expansion based on a heuristic evaluation function, typically the estimated distance to the goal node. ⮚ Unlike UCS, BFS does not consider the actual path cost. Instead, it prioritizes nodes based on the heuristic evaluation function, aiming to explore nodes that arecloser to the goal node first.
⮚ BFS may not necessarily find the optimal path in terms of path cost, but it canbemore efficient in terms of exploration if a good heuristic is used.
Prepared by Mangesh Pangam(XIE)
Comparison:
1. UCS guarantees finding the optimal path in terms of path cost, while BFS does not guarantee optimality but may be more efficient in terms of exploration withagood heuristic.
2. UCS explores nodes in increasing order of path cost, whereas BFS explores nodes based on the heuristic evaluation function.
3. Both algorithms may require considerable memory resources, especially for largesearch spaces, as they need to maintain the priority queue or the set of nodes tobeexplored.
4. The choice between UCS and BFS depends on the specific problemdomain, theavailability of a good heuristic, and the desired optimality of the solution.
Q3. b. Explain various stages in the Data analytics Lifecycle. (10 marks) Ans-
The Data analytic lifecycle is designed for Big Data problems & data science projects. The cycle is iterative to represent real project.
To address the distinct requirements for performing analysis on Big Data, step – by–step methodology is needed to organize the activities and tasks involved with acquiring, processing, analyzing, and repurposing data.
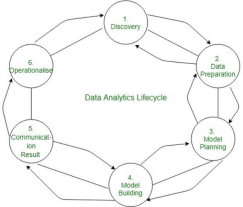
Phase 1: Discovery –
⮚ The data science team learn and investigate the problem.
⮚ Develop context and understanding.
⮚ Come to know about data sources needed and available for the project. ⮚ The team formulates initial hypothesis that can be later tested with data.
Prepared by Mangesh Pangam(XIE)
Phase 2: Data Preparation –
⮚ Steps to explore, preprocess, and condition data prior to modeling and analysis. ⮚ It requires the presence of an analytic sandbox, the team execute, load, and transform, to get data into the sandbox.
⮚ Data preparation tasks are likely to be performed multiple times and not in predefined order.
⮚ Several tools commonly used for this phase are – Hadoop, Alpine Miner, OpenRefine, etc.
⮚ Phase 3: Model Planning –
⮚ Team explores data to learn about relationships between variables and subsequently, selects key variables and the most suitable models.
⮚ In this phase, data science team develop data sets for training, testing, and production purposes.
⮚ Team builds and executes models based on the work done in the model planningphase.
⮚ Several tools commonly used for this phase are – Matlab, STASTICA.
Phase 4: Model Building –
⮚ Team develops datasets for testing, training, and production purposes. ⮚ Team also considers whether its existing tools will suffice for running the models or if they need more robust environment for executing models.
⮚ Free or open-source tools – Rand PL/R, Octave, WEKA.
⮚ Commercial tools – Matlab , STASTICA.
Phase 5: Communication Results –
⮚ After executing model team need to compare outcomes of modeling to criteria established for success and failure.
⮚ Team considers how best to articulate findings and outcomes to various teammembers and stakeholders, taking into account warning, assumptions. ⮚ Team should identify key findings, quantify business value, and develop narrativeto summarize and convey findings to stakeholders.
Phase 6: Operationalize –
⮚ The team communicates benefits of project more broadly and sets up pilot project to deploy work in controlled way before broadening the work to full enterprise of users.
Prepared by Mangesh Pangam(XIE)
⮚ This approach enables team to learn about performance and related constraints of the model in production environment on small scale  , and make adjustments before full deployment.
⮚ The team delivers final reports, briefings, codes.
⮚ Free or open source tools – Octave, WEKA, SQL, MADlib.
Q4. a. Explain SVM in detail. (10 marks)
Ans-
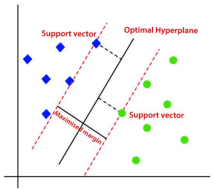
1. Support Vector Machine or SVM is one of the most popular Supervised Learningalgorithms, which is used for Classification as well as Regression problems. 2. However, primarily, it is used for Classification problems in Machine Learning. 3. The goal of the SVM algorithm is to create the best line or decision boundarythat can segregate n-dimensional space into classes so that we can easily put the newdata point in the correct category in the future.
4. This best decision boundary is called a hyperplane.
5. SVM chooses the extreme points/vectors that help in creating the hyperplane. 6. These extreme cases are called as support vectors, and hence algorithmis termedas Support Vector Machine.
7. Consider the below diagram in which there are two different categories that are classified using a decision boundary or hyperplane:
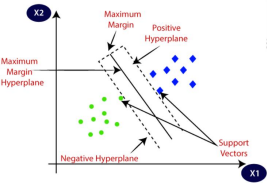
Hyperplane and Support Vectors in the SVM algorithm: 1. Hyperplane:
There can be multiple lines/decision boundaries to segregate the classes in n- dimensional space, but we need to find out the best decision boundary that helps toclassify the data points. This best boundary is known as the hyperplane of SVM.
Prepared by Mangesh Pangam(XIE)
2. Support Vectors:
The data points or vectors that are the closest to the hyperplane and which affect the position of the hyperplane are termed as Support Vector. Since these vectors support the hyperplane, hence called a Support vector.
Types of SVM
SVM can be of two types:
1. Linear SVM:
Linear SVM is used for linearly separable data, which means if a dataset can be classified into two classes by using a single straight line, then such data is termed as linearly separable data, and classifier is used called as Linear SVMclassifier.
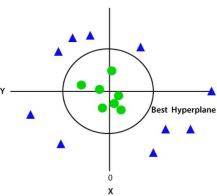
2. Non-linear SVM:
Non-Linear SVM is used for non-linearly separated data, which means if a dataset cannot be classified by using a straight line, then such data is termed as non-linear data and classifier used is called as Non-linear SVM classifier.
Prepared by Mangesh Pangam(XIE)
Q4. b. Describe PEAS and also write down the PEAS representations forMedical diagnosis system. (10 marks)
Ans-
PEAS stands for Performance Measures, Environment, Actuators, and Sensors. Performance Measure: If the objective function to judge the performance of the agent. For example, in case of pick and place robot, no of correct parts in a bin canbethe performance measure.
Environment: It the real environment where the agent need to deliberate actions. Actuators: These are the tools, equipment or organs using which agent performs actions in the environment. This works as output of the agent.
Sensors: These are tools, organs using which agent captures the state of the environment. This works as input to the agent.
4. Sensors – Keyboard, mouse
Q5. a. Write in detail issues in machine learning. (10 marks) Ans-
Although machine learning is being used in every industry and helps organizations make more informed and data-driven choices that are more effective than classical methodologies, it still has so many problems that cannot be ignored. Here are some common issues in Machine Learning that professionals face to inculcate ML skills and create an application from scratch.
Prepared by Mangesh Pangam(XIE)
1. Inadequate Training Data
a. The major issue that comes while using machine learning algorithms is the lackof quality as well as quantity of data.
b. Although data plays a vital role in the processing of machine learning algorithms, many data scientists claim that inadequate data, noisy data, and unclean data areextremely exhausting the machine learning algorithms.
c. For example, a simple task requires thousands of sample data, and an advancedtask such as speech or image recognition needs millions of sample data examples. d. Further, data quality is also important for the algorithms to work ideally, but theabsence of data quality is also found in Machine Learning applications. e. Data quality can be affected by some factors as follows:
⮚ Noisy Data- It is responsible for an inaccurate prediction that affects the decisionas well as accuracy in classification tasks.
⮚ Incorrect data- It is also responsible for faulty programming and results obtainedin machine learning models. Hence, incorrect data may affect the accuracy of theresults also.
⮚ Generalizing of output data- Sometimes, it is also found that generalizing output data becomes complex, which results in comparatively poor future actions.
2. Poor quality of data
a. As we have discussed above, data plays a significant role in machine learning, and it must be of good quality as well.
b. Noisy data, incomplete data, inaccurate data, and unclean data lead to less accuracy in classification and low-quality results.
c. Hence, data quality can also be considered as a major common problemwhile processing machine learning algorithms.
3. Non-representative training data
a. To make sure our training model is generalized well or not, we have to ensure that sample training data must be representative of new cases that we need to generalize.
b. The training data must cover all cases that are already occurred as well as occurring.
Prepared by Mangesh Pangam(XIE)
c. Further, if we are using non-representative training data in the model, it results inless accurate predictions.
d. A machine learning model is said to be ideal if it predicts well for generalizedcases and provides accurate decisions.
e. If there is less training data, then there will be a sampling noise in the model, called the non-representative training set.
f. It won’t be accurate in predictions. To overcome this, it will be biased against oneclass or a group.
g. Hence, we should use representative data in training to protect against being biased and make accurate predictions without any drift.
4. Overfitting and Underfitting
Overfitting:
Overfitting is one of the most common issues faced by Machine Learning engineers and data scientists. Whenever a machine learning model is trained with a huge amount of data, it starts capturing noise and inaccurate data into the training data set. It negatively affects the performance of the model
Methods to reduce overfitting:
⮚ Increase training data in a dataset.
⮚ Reduce model complexity by simplifying the model by selecting one withfewer parameters
⮚ Ridge Regularization and Lasso Regularization
⮚ Early stopping during the training phase
⮚ Reduce the noise
⮚ Reduce the number of attributes in training data.
⮚ Constraining the model.
Underfitting:
Underfitting is just the opposite of overfitting. Whenever a machine learning model is trained with fewer amounts of data, and as a result, it provides incomplete and inaccurate data and destroys the accuracy of the machine learning model. Methods to reduce Underfitting:
⮚ Increase model complexity
⮚ Train on increased &better features
⮚ Remove noise from the data
⮚ Reduce the constraints
Prepared by Mangesh Pangam(XIE)
5. Monitoring and maintenance
As we know that generalized output data is mandatory for any machine learning model; hence, regular monitoring and maintenance become compulsory for the same. Different results for different actions require data change; hence editing of codes as well as resources for monitoring them also become necessary.
6. Getting bad recommendations
A machine learning model operates under a specific context which results in bad recommendations and concept drift in the model. However, we can overcome this byregularly updating and monitoring data according to the expectations.
7. Lack of skilled resources
Although Machine Learning and Artificial Intelligence are continuously growing inthe market, still these industries are fresher in comparison to others. The absence of skilled resources in the form of manpower is also an issue. Hence, we need manpower having in-depth knowledge of mathematics, science, and technologies for developingand managing scientific substances for machine learning.
8. Customer Segmentation
Customer segmentation is also an important issue while developing a machine learning algorithm. To identify the customers who paid for the recommendations shown by the model and who don’t even check them. Hence, an algorithmis necessary to recognize the customer behavior and trigger a relevant recommendationfor the user based on past experience.
9. Lack of Explainability
This basically means the outputs cannot be easily comprehended as it is programmedin specific ways to deliver for certain conditions. Hence, a lack of explainability is also found in ml algorithms which reduce the credibility of the algorithms.
10. Data Bias
Data Biasing is also found a big challenge in Machine Learning. These errors exist when certain elements of the dataset are heavily weighted or need more importance than others. Biased data leads to inaccurate results, skewed outcomes, and other analytical errors. Further, take necessary steps to reduce it.
Prepared by Mangesh Pangam(XIE)
Q5. b. Elaborate in detail the steps in developing a Machine Learning application with architectural diagram. (10 marks)
Ans-
Machine learning has given the computer systems the abilities to automatically learnwithout being explicitly programmed. But how does a machine learning systemwork?So, it can be described using the life cycle of machine learning. Machine learninglifecycle is a cyclic process to build an efficient machine learning project. The main purpose of the life cycle is to find a solution to the problem or project.
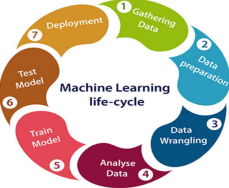
Machine learning life cycle involves seven major steps, which are given below: 1. Gathering Data:
a. Data Gathering is the first step of the machine learning life cycle. The goal of this step is to identify and obtain all data-related problems.
b. In this step, we need to identify the different data sources, as data can be collected from various sources such as files, database, internet, or mobile devices. c. It is one of the most important steps of the life cycle.
d. The quantity and quality of the collected data will determine the efficiency of theoutput.
e. The more will be the data, the more accurate will be the prediction. f. This step includes the below tasks:
⮚ Identify various data sources
⮚ Collect data
⮚ Integrate the data obtained from different sources
g. By performing the above task, we get a coherent set of data, also called as a dataset. It will be used in further steps.
Prepared by Mangesh Pangam(XIE)
2. Data preparation
a. After collecting the data, we need to prepare it for further steps. b. Data preparation is a step where we put our data into a suitable place and prepareit to use in our machine learning training.
c. In this step, first, we put all data together, and then randomize the ordering of data.
d. This step can be further divided into two processes:
● Data exploration:
It is used to understand the nature of data that we have to work with. We need to understand the characteristics, format, and quality of data. A better understanding of data leads to an effective outcome. In this, we findCorrelations, general trends, and outliers.
● Data pre-processing:
Now the next step is preprocessing of data for its analysis.
3. Data Wrangling
a. Data wrangling is the process of cleaning & converting raw data into a useable format.
b. It is the process of cleaning the data, selecting the variable to use, and transforming the data in a proper format to make it more suitable for analysis inthe next step.
c. It is one of the most important steps of the complete process.
d. Cleaning of data is required to address the quality issues.
e. It is not necessary that data we have collected is always of our use as some of thedata may not be useful.
f. In real-world applications, collected data may have various issues, including: ⮚ Missing Values
⮚ Duplicate data
⮚ Invalid data
⮚ Noise
g. So, we use various filtering techniques to clean the data.
h. It is mandatory to detect and remove the above issues because it can negativelyaffect the quality of the outcome.
Prepared by Mangesh Pangam(XIE)
4. Data Analysis
a. Now the cleaned and prepared data is passed on to the analysis step. b. This step involves:
⮚ Selection of analytical techniques
⮚ Building models
⮚ Review the result
c. The aim of this step is to build a machine learning model to analyze the data using various analytical techniques and review the outcome. d. It starts with the determination of the type of the problems, where we select the machine learning techniques such as Classification, Regression, Cluster analysis, Association, etc. then build a model using prepared data, evaluate the model.
e. Hence, in this step,we take data & use ml algorithms to build the model.
5. Train Model
Now the next step is to train the model, in this step we train our model to improve its performance for better outcome of the problem.
We use datasets to train the model using various machine learning algorithms. Training a model is required so that it understand the various patterns, rules, features.
6. Test Model
a. Once our ml model has been trained on given dataset, then we test on model. b. In this step, we check for the accuracy of our model by providing a test dataset toit.
c. Testing the model determines the percentage accuracy of the model as per the requirement of project or problem.
7. Deployment
a. The last step of machine learning life cycle is deployment, where we deploy themodel in the real-world system.
b. If the above-prepared model is producing an accurate result as per our requirement with acceptable speed, then we deploy the model in the real system. c. But before deploying the project, we will check whether it is improving its performance using available data or not.
d. The deployment phase is similar to making the final report for a project.
Prepared by Mangesh Pangam(XIE)
Q6. a. What are the different planning techniques? Explain with example. (10 marks)
Ans-
The various planning techniques are:-
Sure, let’s delve into each of these planning techniques with examples:
1. Partial Order Planning:
a. Partial Order Planning (POP) is a planning technique that allows flexibility intheordering of actions, unlike strict sequential ordering.
b. Plans are represented as partial orders, where actions can be executedconcurrently or in any order as long as their preconditions and effects aresatisfied.
c. POP employs techniques like causal links and threats to resolve orderingconstraints and achieve the desired goals.
Example:
Suppose you’re planning a weekend trip to a beach destination. Your goal is to havefun while managing your time efficiently. Here’s a simplified partial order plan: ● Buy sunscreen, swimsuit, and snacks (can be done concurrently). ● Drive to the beach (after buying essentials).
● Set up beach umbrella and chairs (can be done concurrently with driving). ● Apply sunscreen and change into swimsuit (can be done concurrently withdriving or after arriving at the beach).
● Enjoy swimming and sunbathing.
2. Hierarchical Planning:
a. Hierarchical Planning organizes planning problems into hierarchical structures, decomposing complex tasks into simpler subtasks.
b. Plans are represented as task networks with hierarchical relationships anddecomposition constraints.
c. Hierarchical Planning algorithms recursively decompose high-level tasks intolower-level subtasks until primitive actions are reached.
Example:
Consider the task of baking a cake. Hierarchical planning breaks down the taskintosubtasks and sub-subtasks:
High-level task: Bake a cake
Prepared by Mangesh Pangam(XIE)
● Subtask: Prepare ingredients
● Subtask: Mix ingredients
■ Sub-subtask: Beat eggs, combine dry ingredients, etc.
● Subtask: Bake the batter
■ Sub-subtask: Preheat oven, pour batter into pan, set timer, etc.
● Subtask: Decorate the cake
■ Sub-subtask: Frosting, sprinkles, candles, etc.
3. Conditional Planning:
a. Conditional Planning deals with uncertainty and changing conditions byconsidering possible future states and planning accordingly.
b. Plans are represented as sequences of actions and conditions, where actions arechosen based on the current state and predicted future states.
c. Conditional Planning algorithms often use techniques like decision trees or probabilistic models to reason about uncertainty and make decisions. Example:
Suppose you’re planning a picnic, but the weather forecast predicts possible rain. Youcreate a conditional plan:
⮚ If the weather is sunny: Go to the park, pack sandwiches, and bring a Frisbee. ⮚ If the weather is cloudy: Bring umbrellas and consider an indoor backup plan, such as a board game night at home.
⮚ If the weather is rainy: Cancel the outdoor picnic and plan for an indoor activity, like movie night with popcorn.
Q6. b. What do you mean by covariance and correlation? Explain the range of coefficients of correlation and covariance. Calculate COV(Observed Value1, Observed Value2) and CORRCOV(Observed Value1, Observed Value2) forfollowing data. How do you interpret these values? (10 marks)Prepared by Mangesh Pangam(XIE)
Ans-
Covariance and Correlation – Refer Q1.c
Observed Value1: 38, 62, 22, 38, 45, 69, 75, 38, 80, 32, 51, 56, 21, 34, 76 Observed Value2: 20, 15, 30, 21, 18, 12, 14, 28, 9, 22, 20, 19, 28, 23, 14
1. Mean of Observed Value1 = (38 + 62 + 22 + 38 + 45 + 69 + 75 + 38 + 80 +32+51 + 56 + 21 + 34 + 76) / 15 ≈ 50.13
2. Mean of Observed Value2 = (20 + 15 + 30 + 21 + 18 + 12 + 14 + 28 + 9 +22+20 + 19 + 28 + 23 + 14) / 15 ≈ 19.6
Calculating Covariance:
COV(Observed Value1, Observed Value2)
= Σ [(Observed Value1 – Mean of Observed Value1) * (Observed Value2 – Meanof Observed Value2)] / (n – 1)
= [(38 – 50.13) * (20 – 19.6) + (62 – 50.13) * (15 – 19.6) + … + (76 – 50.13) * (14- 19.6)] / 14 ≈ -52.84
Standard Deviation of Observed Value1 ≈ 21.518
Standard Deviation of Observed Value2 ≈ 6.957
Calculating Correlation:
CORRCOV(Observed Value1, Observed Value2)
= COV(Observed Value1, Observed Value2) / (std dev of Observed Value1 * stddevof Observed Value2)
≈ -52.84 / (21.518 * 6.957)
≈ -0.3555
The covariance between Observed Value1 and Observed Value2 is approximately- 52.84. This negative covariance indicates a negative relationship between the variables, meaning that as one variable increases, the other tends to decrease. The correlation coefficient between Observed Value1 and Observed Value2 is approximately -0.3555. This negative correlation coefficient also indicates a negativelinear relationship between the variables. The magnitude of the correlation coefficient suggests a moderate negative linear relationship between the variables.
Prepared by Mangesh Pangam(XIE)
